2020 United States Presidential Election Model
Hi, I'm Wyatt Entrekin, a 3rd-year Industrial Engineering student at the Georgia Institute of Technology
with a strong interest in data analysis and a fascination with electoral politics.
I created this election model as the result of a desire to develop my programming skills and a near obsession with the topic.
Below, you will see the results of the model, an explanation of the methods I used to produce the data you're looking at, and some interesting insights I gathered from these results.
If you have any questions, wish to connect professionally, or are interested in learning more about the project,
feel free to email me at wmentrekin@gmail.com,
connect with me on LinkedIn,
or check out the code on GitHub.
Methods
Disclaimer: This model is not an official prediction. I am in no way attesting to its potential accuracy or claiming it to be correct.
The point of this project was to be a learning exercise for me as well as an outlet for an interest of mine. I am not in any way a professional election forecaster.
Nonetheless, I hope this peaks your interest.
When I first decided to begin working on this model in August, I wanted to challenge myself to learn more about different Python libraries,
such as Scipy, Numpy, Pandas, and Matplotlib and to see if I could come up with anything accurate. I utilized my prior skills in webscraping
and data manipulation while using new knowledge in statistics and data visualization. The entire model is written in Python.
This model essentially uses election data from 2016 and polling for this current election cycle to create a rough forecast of the 2020 election.
I gathered data about all 50 states and the District of Columbia from the census website,
2016 election data from the FEC website, 2020 election polling data from 270 to win,
and pollster ratings and bias from 538.
After the data was gathered and cleaned, I had three classes of objects: States, Polls, and Pollsters. I wanted to use the data I gathered about each of these objects,
to implement this model. The model thus breaks down into these parts: correcting polls based on the grade and historical bias of their pollsters,
aggregating polls in each state into a singular rating with a vote share for both candidates and margin of error based on the combined margins of all the polls
(for states with no polling data, this rating was simply based on the 2016 election results, as states with no polling data are not assumed to be competitive
or change much in their results from the prior election cycle), combining the prior election results and the ratings for each state into distributions of possible vote share
for each candidate in each state, simulating 10,000 races in each state, and visualizing the data with the map and graphs you see below.
Results
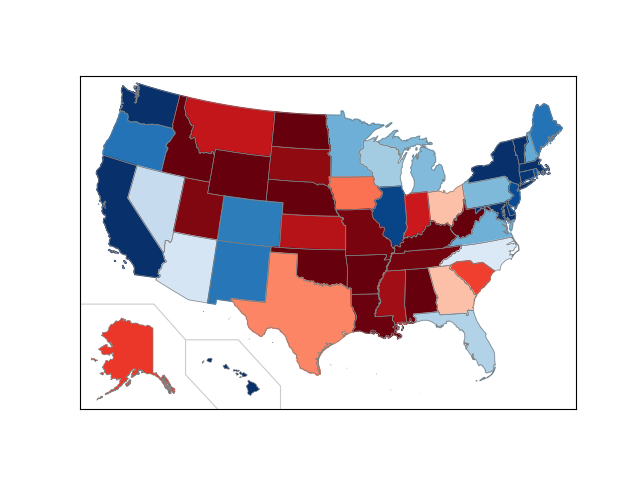
Average Margin of Victory
In the model, there are 10,000 scenarios that were run. This map visualizes the average margin of victory of either candidate in each state on a color scale.
States in blue are projected to be won by former Vice President Joe Biden, whereas states in red are projected to be won by incumbent President Donald Trump.
The darker the color of the state, the larger the margin expected for the winning candidate.
Closest Projected Margins of Victory
The table below shows states where the winner is projected to win by less than 10% of the vote.
Most Lopsided Projected Margins of Victory
The table below shows states where the winner is projected to win by more than 25% of the vote.
Projected Tossup States
The table below shows states where both candidates have at least a 40% chance of winning.
Projected Flipped States
This table below shows states where the projected winner in 2020 is from a different party than the one which won in 2016.
Full Results
The table below shows the full results of the model in all 50 states and the District of Columbia.
Below you can see, for each state, the projected vote share for either candidate, the chance of victory, and the projected vote margin from the model.
Win Probabilities & Expected Electoral Votes
The table below represents the expected value of electoral votes and chance of winning the electoral college for either candidate.
The expected value of electoral votes was found by multiplying both candidates' probabilities of winning in every state by the electoral votes of every state.
The chances of victory are simply a proportion of the scenarios in my model in which either candidate wins the electoral college.
Insights
The first interesting result that I noted while getting the first results of this model were how some states have very slim projected margins
while the candidate favored to win had very high chances of victory. For example, Donald Trump is expected to win South Carolina and Alaska by
margins of less than 10%, yet has more than 80% chance of victory in both states. Likewise, Joe Biden is expected to win both Minnesota and Virginia by
margins of less than 5%, yet has more than 90% chance of victory in both states. This is probably a result of the polling data in these states having low variance and error.
Next, I noticed that the model only predicts four true toss-up states: North Carolina, Arizona, Ohio, and Georgia, all of which Donald Trump won in 2016.
While candidates campaign all over the country, many of the states they visit are, at least statistically, already likely to vote a certain way.
This reflects in the projected flipped states as well, where all of them are expected to flip from Trump to Biden, with Biden projected to win by larger
margins than Trump won them in 2016, with the exception of Arizona and North Carolina, which out of these states, are the more traditionally Republican states.
Lastly, my model gives Joe Biden an almost guaranteed victory in the electoral college. While many models and pundits show Biden as the favorite, I am wary of the results of my own model.
In general, I believe that my results don't paint an unrealistic picture, but that some of the numbers can be potentially misleading. The goal was not to definitively predict the winner of the election,
but rather to project the chances of victory and vote shares in each state. Nonetheless, Joe Biden wins in almost every scenario. I believe that my model's victory chances don't necessarily represent an accurate number,
but that they do reflect the narrow path to victory for the incumbent president. While Joe Biden has many paths to the presidency (winning in the Rust Belt, the South, or the Southwest), Trump's chance rely heavily on repeating as closely his
victory in 2016, which relied heavily on slim margins in key states. While this model gives the president decent chances in states he needs to win, such as Wisconsin, Michigan, Pennsylvania, and Florida,
there are not many scenarios where my model has him winning all or enough of them to secure a victory. It shows that Biden can win either by close margins or in a landslide, but that if Trump wins, it will be a narrow victory.
My model, regardless of how accurate it turns out to be, shows that this election is not unlike 2016, in that this is the Democrats' election to lose and that Donald Trump needs to perform in a very specific way to win another term.
Overall, most of the simulations project Joe Biden winning with around 310-340 electoral votes to Donald Trump's 200-230 electoral votes.